SIR model
\( \frac{\mathrm{d}}{\mathrm{d}t}I=r\beta I\frac{S}{N}-\gamma I \\ \frac{\mathrm{d}}{\mathrm{d}t}S=-r\beta I\frac{S}{N} \\ \frac{\mathrm{d}}{\mathrm{d}t}R=\gamma I\)
View all models and descriptions: Infectious disease model simulation and theoretical trends
clear
figure
N = 300;   % total population
I = 3;     % infector state == 1
S = N-I;   % susceptible state == 0
R = 0;     % recovered state == 2

r = 2;     % number of infected persons contacting susceptible persons
B = 0.05;  % probability of infection
y = 0.03;  % recovery probability
days = 500;
Dynamic = false;  %Set to true to show the dynamic process

Sdata=[];

state=zeros(1,N);
index=randperm(N,I);
state(index)=1;
if Dynamic
    axis([0 N 0 N]);
    hold on
end
for i=1:days
    xpos=randperm(N);
    ypos=randperm(N);
    for j=1:N
        if state(j)~=1
            continue
        end
        if rand()<=y
            state(j)=2;
            continue
        end
        dis=sqrt((xpos-xpos(j)).^2+(ypos-ypos(j)).^2);
        l=0;
        for k=1:N
            if state(k)==1 || state(k)==2
                continue
            end
            l=l+1;
            peo(l).dis=dis(k);
            peo(l).num=k;
        end
        T = struct2table(peo);
        sortedT = sortrows(T,'dis');
        sortedS = table2struct(sortedT);
        tp=sortedT{1:r,2};
        for k=1:length(tp)
            if rand()<=B
                state(tp(k))=1;
            end
        end
    end
    Idata(i)=length(find(state==1));
    Sdata(i)=length(find(state==0));
    Rdata(i)=length(find(state==2));
    %a=-8;
    %b=8;
    %xpos=xpos+ a + (b-a).*rand(1,N);
    %ypos=ypos+ a + (b-a).*rand(1,N);
    if Dynamic && rem(i,10)==0
        phd=scatter(xpos,ypos,[],state,"filled");
        title(['Day ' num2str(i)])
        drawnow
        delete(phd)
    end
end

figure
set(gcf,'visible',true)
days=length(Sdata);
plot(1:days,Sdata,1:days,Idata,1:days,Rdata)
hold on
T = 1:days+100;
for idx = 1:length(T)-1
    if S(idx)<0
        S(idx)=0;
    elseif S(idx)>N
        S(idx)=N;
    end
    if I(idx)<0
        I(idx)=0;
    elseif I(idx)>N
        I(idx)=N;
    end
    if R(idx)<0
        R(idx)=0;
    elseif R(idx)>N
        R(idx)=N;
    end
    S(idx+1) = S(idx) - r*B*S(idx)*I(idx)/N;
    I(idx+1) = I(idx) + r*B*S(idx)*I(idx)/N - y*I(idx);
    R(idx+1) = R(idx) + y*I(idx);
end

plot(T,S,T,I,T,R);
legend ('simulated susceptible person', 'simulated infectious person', 'simulated recovered person', 'susceptible person', 'infected person', 'recovered person')
xlabel ('day'); ylabel ('number of people')
title ('SIR model')Code language: Matlab (matlab)
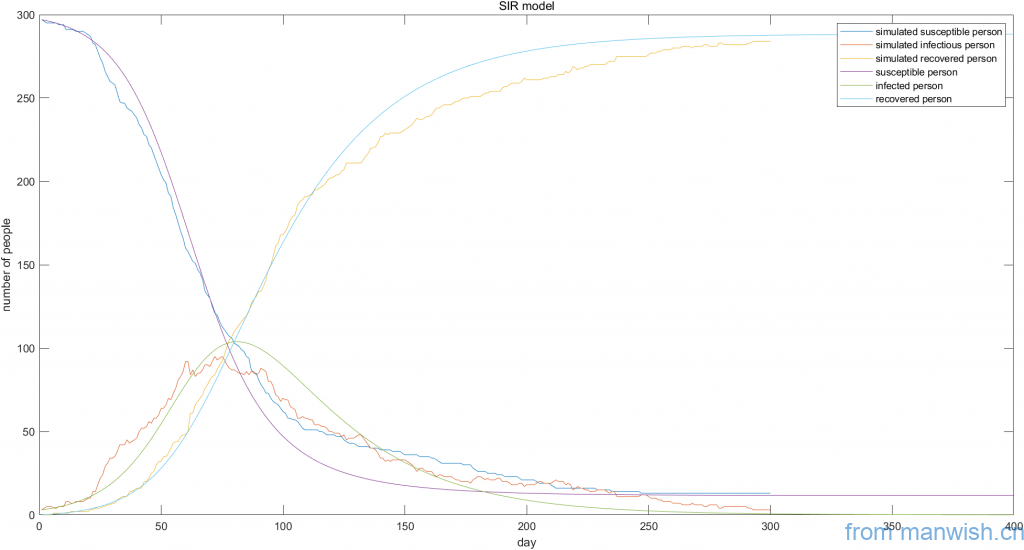
The final screenshot of the simulation is as follows (the dynamic process is not given):

Unless otherwise stated, the articles are original.
Title of this article:Dynamic simulation and theoretical curve of SIR virus model
Hyperlink to this article:https://manwish.cn/en/article/dynamic-simulation-and-theoretical-curve-of-sir-virus-model-en.html
Title of this article:Dynamic simulation and theoretical curve of SIR virus model
Hyperlink to this article:https://manwish.cn/en/article/dynamic-simulation-and-theoretical-curve-of-sir-virus-model-en.html